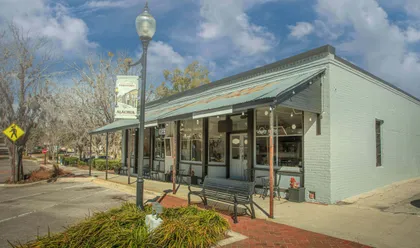
Small businesses make up 99.9% of all U.S. businesses: the Small Business Administration's Office of Advocacy counts 36.2 million, using 2022 Census data. Of those, 29.8 million have no employees. Business applications reached 5,671,836 in 2025, a record full-year total.

The 5,671,836 business applications filed in 2025 are the highest full-year total in Census data going back to July 2004. Nearly half of new business locations with employees last 5 years: of private-sector establishments that opened in the year ended March 2021, 47.2% were still operating in March 2026, Bureau of Labor Statistics (BLS) data show.
Key small business statistics
Each figure comes with its source and the period it covers.
Statistic | Figure | Source and period |
|---|---|---|
Small businesses in the U.S. | 36.2 million (99.9% of all businesses) | SBA Office of Advocacy, 2022 data |
Small businesses with no employees | 29.8 million (about 82%) | SBA Office of Advocacy, 2022 data |
Small businesses' share of firms with employees | 99.7% | SBA Office of Advocacy, 2022 data |
People employed by small businesses | 62.3 million (45.9% of private-sector workers) | SBA Office of Advocacy, 2022 data |
Business applications | 5,671,836 | Census Business Formation Statistics, 2025 |
Business applications, January–September 2026 | 4,927,840 (up 15.3% from the same months of 2025) | Census Business Formation Statistics |
New business locations with employees still operating after 1 year | 78.9% | BLS, opened in the year ended March 2025 |
New business locations with employees still operating after 5 years | 47.2% | BLS, opened in the year ended March 2021 |
New business locations with employees still operating after 10 years | 34.2% | BLS, opened in the year ended March 2016 |
Employer-firm applicants that got the full amount they sought | 42% | Federal Reserve Small Business Credit Survey, 2025 (convenience sample) |
Statistic
Sources: SBA Office of Advocacy 2025 Small Business Profile and February 2026 FAQ; Census Business Formation Statistics (sum of monthly figures, not seasonally adjusted); BLS Business Employment Dynamics (private-sector establishments with employees); Federal Reserve Banks; checked October 2026.
What counts as a small business
For research, the SBA Office of Advocacy generally defines a small business as an independent business with fewer than 500 employees. Government programs and contracting use separate industry-level size standards. Having fewer than 500 employees doesn’t automatically qualify a business for an SBA loan or a small-business contract. Program rules vary, and size calculations may include affiliated businesses. Depending on the industry, the applicable standard may use employees or annual receipts.
Four terms help you read the numbers:
- Firm and establishment: Census calls a single physical location of a business an establishment, and a business organization of one or more establishments under the same owner a firm
- Nonemployer business: Census Nonemployer Statistics cover businesses with no paid employees that are subject to federal income taxes and have receipts of $1,000 or more, or $1 or more in construction. Census builds these counts primarily from business income tax returns filed with the Internal Revenue Service (IRS).
- Survival data: BLS survival figures come from a quarterly census of all establishments under state unemployment insurance programs, so they cover business locations with employees
- Data year: the SBA's small business counts are based on Census's 2022 Statistics of U.S. Businesses and 2022 Nonemployer Statistics, so we label them 2022 data
If you're planning your own, see how to start a small business, step by step.
How many small businesses are there?
The U.S. had 36.2 million small businesses in 2022, 99.9% of all U.S. businesses, plus 21,041 large businesses, the SBA Office of Advocacy says. Of the small businesses, 29.8 million, or about 82%, had no employees. Of the 6.37 million with employees, 89.7% had 1–19 employees and 654,501 had 20–499.
Newer Census Nonemployer Statistics count 31,985,874 businesses without paid employees in 2024.
By legal form
The SBA Office of Advocacy counts small businesses by legal form, such as sole proprietorships, partnerships, S corporations, and C corporations.
Legal form, 2022 | Share of nonemployer businesses | Share of small employer firms |
|---|---|---|
Sole proprietorship | 86.7% | 12.3% |
Partnership | 7.3% | 12.1% |
S corporation | 4.5% | 55% |
C corporation and other | 1.5% | 13.9% |
Legal form, 2022
Source: SBA Office of Advocacy, Frequently Asked Questions About Small Business (February 2026), Table 3 and Figure 6.
These categories don’t give a separate count of LLCs. An LLC is created under state law, while its federal tax treatment may place it in a sole-proprietor, partnership, or corporation category. S corporation status is a tax election that an eligible corporation or LLC can make, SBA notes. See how LLCs, S corps, and C corps compare.
By industry
Professional, scientific, and technical services had the most small businesses in 2022, counting businesses with and without employees.
Industry, 2022 | Small businesses |
|---|---|
Professional, scientific, and technical services | 4,881,738 |
Transportation and warehousing | 4,089,883 |
Other services (except public administration) | 3,860,519 |
Construction | 3,656,782 |
Real estate and rental and leasing | 3,510,689 |
Source: SBA Office of Advocacy, 2025 Small Business Profile: United States (Census Nonemployer Statistics and Statistics of U.S. Businesses, 2022).
In Census's 2024 Nonemployer Statistics, transportation and warehousing led businesses without employees with 4,484,838, ahead of professional, scientific, and technical services with 4,233,838. Explore small business ideas by industry and how NAICS industry codes work.
By revenue
Most businesses without employees had receipts under $25,000 in 2024: 60.4%, including 22.4% under $5,000, according to Census Nonemployer Statistics. Only 567,227, or 1.8%, had $500,000 or more, and 126,356, or 0.4%, had $1 million or more. These are receipts, not profit, for businesses without employees only.
Small businesses by state
California has the most small businesses, 4.34 million, followed by Texas with 3.52 million and Florida with 3.49 million, the SBA Office of Advocacy's 2025 state profiles show. Florida led the country in new business applications in 2025, Census data show.
State | Small businesses (SBA 2025 profile) | Business applications, 2025 | Change since 2019 |
|---|---|---|---|
Florida | 3.49 million | 647,734 | +65.2% |
California | 4.34 million | 553,931 | +51.7% |
Texas | 3.52 million | 544,146 | +78.3% |
New York | 2.4 million | 301,047 | +31.7% |
Georgia | 1.4 million | 254,582 | +47.9% |
State
Sources: SBA Office of Advocacy 2025 Small Business Profiles; Census Business Formation Statistics, sum of monthly figures, not seasonally adjusted; checked October 2026. The five states with the most business applications in 2025.
Montana has the highest share of private sector employment at small businesses, at 66.3%, followed by Wyoming at 65.2% and Vermont at 62.1%. Small businesses employ 46.6% of New York employees and 42.5% of Georgia employees.
Among companies formed through Bizee, Texas stayed first while Wyoming, New Mexico, and Montana gained share and Delaware fell:
Formation state | October 2024 – September 2025 | October 2025 – September 2026 |
|---|---|---|
Texas | 12.9% | 13.5% |
California | 11.1% | 10.7% |
Florida | 9.2% | 9.0% |
Wyoming | 8.7% | 9.4% |
Delaware | 4.9% | 4.0% |
New Mexico | 3.2% | 3.8% |
Montana | 0.8% | 1.2% |
Formation state
Source: Bizee internal data, formation orders, October 1, 2024 – September 30, 2026, by the state the company was formed in, not where the owner lives or operates. A shift in Bizee's own customer mix, not a national state trend.
SBA says an LLC, corporation, partnership, or nonprofit corporation doing business in more than one state might need to form in one state and file for foreign qualification in the others. SBA adds that foreign-qualified businesses typically need to pay taxes and annual report fees in both their state of formation and the states where they're foreign qualified.
This report explains what the data and rules show; it isn't legal or tax advice. Confirm details with your state's filing office, or ask a licensed attorney or CPA.
How many business applications are filed each year?
Census's monthly counts add up to 5,671,836 business applications in 2025, the highest full-year total in its Business Formation Statistics. Census counts applications for an employer identification number (EIN) made predominantly for business purposes. Learn how to get an EIN.
Year | Business applications |
|---|---|
2019 | 3,498,990 |
2020 | 4,356,498 |
2021 | 5,390,816 |
2022 | 5,062,563 |
2023 | 5,469,302 |
2024 | 5,224,176 |
2025 | 5,671,836 |
Source: Census Business Formation Statistics, sum of the 12 monthly figures, not seasonally adjusted; checked October 2026.
An IRS online EIN outage from December 30, 2025, to January 5, 2026, affected Census's December 2025 data.
Only some applications become employer businesses. Of the 5,062,563 applications filed in 2022, 296,531, about 1 in 17, did so within four quarters, according to Census. In the September 2026 release, actual four-quarter formation data extend through applications filed in December 2022; more recent figures are projections.
These numbers don’t mean the other applicants failed. Some may operate without paid employees, hire later, or never begin operating. This measure tracks the transition to an employer business within a specific period, not overall business success.
The pace picked up in 2026. January–September applications totaled 4,927,840, 15.3% more than in the same months of 2025. In September 2026, seasonally adjusted applications were 534,947, and retail trade led all industries with 110,048, followed by professional services with 78,937 and construction with 48,078.
How long do small businesses survive?
Nearly half of new business locations with employees last 5 years. Of private-sector establishments with employees that opened in the year ended March 2021, 47.2% were still operating in March 2026, BLS says.
Opened in the year ended | Still operating in March 2026 | Years open |
|---|---|---|
March 2025 | 78.9% | 1 |
March 2024 | 66.6% | 2 |
March 2021 | 47.2% | 5 |
March 2016 | 34.2% | 10 |
March 1994 | 12.0% | 32 |
Opened in the year ended
Source: BLS Business Employment Dynamics, Table 7, private-sector establishments with employees; checked October 2026.
The SBA Office of Advocacy reports long-run figures. From 1994 to 2022, an average of 67.7% of new employer establishments survived at least 2 years. Over the same period, the 5-year survival rate was 49.2%, the 10-year rate 33.9%, and the 15-year rate 25.5%. Survival gets more likely with age: 69.5% of businesses that reach 5 years also reach 10.
Survival by industry
Survival rates vary by industry, BLS says. Of the seven sectors below, retail trade kept the highest share of its establishments that opened in the year ended March 2016, 43.5% after 10 years, and professional, scientific, and technical services the lowest, 34.4%.
Sector, establishments opened in the year ended March 2016 | Still operating in March 2021 | Still operating in March 2026 |
|---|---|---|
Retail trade | 61.9% | 43.5% |
Accommodation and food services | 59.6% | 42.9% |
Other services (except public administration) | 59.4% | 42.6% |
Construction | 58.6% | 41.7% |
Administrative and waste services | 51.0% | 36.0% |
Health care and social assistance | 57.8% | 35.8% |
Professional, scientific, and technical services | 52.4% | 34.4% |
Sector, establishments opened in the year ended March 2016
Source: BLS Business Employment Dynamics, Table 7 for each sector, private-sector establishments with employees; checked October 2026.
These rates cover whole sectors. None of them is a rate for one kind of business, such as a food truck, hair salon, or lawn care business. See also starting a food truck and buying a franchise.
Why small businesses close
SBA Office of Advocacy data show that among businesses with employees that closed in 2015, the top reasons for closing were low sales, the owners retiring, and the owners selling the business. Opening another firm and illness or injury came next, and about 6% of closures were owners closing to start another business.
The SBA's May 2018 fact sheet draws on the Census Annual Survey of Entrepreneurs. It also says about 5% of businesses closed because of credit access in 2015, versus about 14% in 2007, citing that survey and the Census Survey of Business Owners.
Between March 2023 and March 2024, 1,281,290 establishments opened and 1,125,979 closed, the SBA's 2025 profile shows. Small businesses accounted for 1.1 million of the openings and 982,940 of the closings, counts that include temporary closures and reopenings.
In the Federal Reserve's 2025 Small Business Credit Survey, a convenience sample of employer firms, reaching customers and growing sales was the most commonly reported operational challenge, followed by hiring or retaining qualified staff. Rising costs of goods, services, and/or wages were the most common financial challenge.
Our own support data show why some owners formally close a company. When owners told our support team why they were closing their company, nearly 2 in 3 (63%) said it had never really gotten started or had no business activity. About 1 in 5 (22.5%) pointed to the cost or paperwork of keeping it open: state fees, annual reports, or franchise tax. About 1 in 7 (14%) said it wasn't making money. Owners could give more than one reason. Some were replacing it with a different entity (14%), had personal reasons such as retirement or a new job (12%), or were moving (6%).
About 1 in 4 owners who told our support team they were closing (23%) asked about their EIN or closing their IRS business account. About 1 in 6 (17.5%) asked about final tax returns or tax clearance. About 1 in 7 (14%) had unpaid annual reports or franchise tax to deal with first.
Source: Bizee internal data, customer-support conversations with owners closing their companies, April 2, 2025 – October 22, 2026, classified by AI from the transcripts; reasons and topics are those owners stated. Support contacts are not all Bizee customers, and Bizee customers are not all U.S. businesses, so this shows why some owners formally closed a company, not why businesses fail.
The IRS says you must file a final return for the year you close your business; a sole proprietor files Schedule C with the individual tax return for that year.
A real question from a Bizee customer, paraphrased: "Does dissolving my LLC automatically close my EIN?"
No. An EIN is the entity's permanent federal taxpayer ID. To close your IRS business account, you send the IRS a letter with the business's complete legal name, EIN, address, and the reason you're closing it, and the IRS cannot close the account until you've filed all necessary returns and paid all taxes owed.
Among companies we formed that were dissolved through us between July 2 and October 14, 2026, the median company was about 2 years old (737 days); roughly 1 in 4 (23%) was dissolved within its first year.
Source: Bizee internal data, dissolutions recorded July 2 – October 14, 2026. This counts only companies formally dissolved through Bizee in a 15-week window, so it's not a survival or failure rate.
For the steps, see how to dissolve an LLC. Confirm your own closing steps with the IRS and your state's filing office, or ask a licensed attorney or CPA.
Small business employment and the economy
In 2022, small businesses employed 62.3 million people, 45.9% of private-sector workers, the SBA Office of Advocacy says. Small business employment grew 13.1% between 1998 and 2022.
From January 1995 to December 2024, small businesses created 20.7 million net new jobs and large businesses 13.2 million, the SBA says. That's 61% of net new jobs. Between March 2023 and March 2024, they added a net 1.2 million jobs, 88.9% of the U.S. net increase of 1.4 million.
In 2023, small businesses were 97.2% of identified U.S. exporters, 270,014 businesses, the SBA's 2025 profile shows. The SBA's February 2026 FAQ puts their share of known export value at 33.0%, or $588.4 billion.
Small business financing
In the Federal Reserve's 2025 Small Business Credit Survey, 86% of employer firms used financing regularly, most commonly credit cards and loans. In the prior 12 months, 60% applied for financing, most often to meet operating expenses or to expand or pursue a new opportunity.
Employer firms, 2025 Small Business Credit Survey | Share |
|---|---|
Applied for financing in the prior 12 months | 60% |
Applicants that got the full amount they sought | 42% |
Applicants that got some or most | 36% |
Applicants that got none | 22% |
Applicants at small banks that were fully approved | 57% |
Loan, line-of-credit, or cash-advance applicants that applied at online fintech lenders | 29%, up from 17% in the 2020 survey |
Firms with no outstanding debt | 31%, up from 21% in the 2020 survey |
Source: Federal Reserve Banks, 2026 Report on Employer Firms; survey fielded September 3 – November 14, 2025, with 6,525 responses from a convenience sample (not a random sample) of employer firms with 1–499 employees; checked October 2026.
In the Fed's 2025 survey, about half of nonemployer firms had no debt at the time of the survey, and 31% didn't regularly use external financing. They were more likely than employer firms to rely on the owners' personal funds to deal with financial challenges, 64% versus 54%. Compare small business financing options.
Who owns small businesses?
Women owned 14 million U.S. businesses in 2022, 40.4% of all classifiable businesses, including 12.7 million, or 43.8%, of nonemployer firms, the SBA Office of Advocacy says.
Owner group, 2022 | Share of all firms | Share of employer firms |
|---|---|---|
Women | 40.4% | 23.2% |
Hispanic | 16.2% | 8.2% |
Black | 13.3% | 3.4% |
Asian | 9.9% | 11.5% |
Owner group, 2022
Source: SBA Office of Advocacy, Frequently Asked Questions About Small Business (February 2026), Table 2: Business Owner Demographics, 2022.
The same SBA data show minority-owned businesses totaled 13 million, and minority-owned businesses with employees made up 23.5% of all businesses with employees. Veterans owned 1.7 million businesses, 4.8% of all businesses, including 273,523 employer firms. Women-owned employer businesses grew nearly 20% between 2017 and 2023, from 1,134,549 to 1,356,990, Census's 2024 Annual Business Survey shows.
In Census's 2023 Annual Business Survey, which covers 2022, employer-business owners who answered most often chose being their own boss, 62.3%, and greater income, 62.1%, as "very important" reasons for owning a business. There's no statistically significant difference between the two. Nearly half of the owners who answered, 49.3%, were first-time business owners. See starting a business as a woman.
Small business trends, including 2026 data
Census business applications for January–September 2026 ran 15.3% ahead of the same months of 2025, while employer firms in the Federal Reserve's 2025 survey reported their lowest growth expectations since the 2020 survey. Here are six trends in the official data, each with its period:
- More applications, a smaller high-propensity share: applications ran 15.3% ahead of 2025 through September 2026. But high-propensity applications, those with a high likelihood of becoming businesses with payroll, fell to 30.1% of all applications in 2025 from 37.6% in 2019.
- More businesses without employees: from 2012 to 2023, nonemployer businesses grew an average 2.7% a year while employers grew 1.1%, shrinking employers' share of all U.S. businesses from 24.6% to 21.6%, Census says
- Openings peaked in the year ended March 2022: 1,065,228 private-sector establishments opened in the year ended March 2022, the highest number since BLS's series began in 1994, compared with 969,316 in the year ended March 2026
- Costs and tariffs: in the Fed's 2025 survey, more than 4 in 10 employer firms said tariff costs were a financial challenge, and 77% reported rising costs, tariff costs, or both
- Lower expectations: in the same survey, employer firms' revenue expectations index fell from 39 to 33 and their employment index from 26 to 23, the lowest since the 2020 survey
- AI use: 46% of employer firms in the Fed's survey said the business or its employees used AI, another 15% planned to start within 12 months, and one-third had no plans to
What Bizee's formation data show
We help people form companies, so our order data show who forms one and how.
What the data show | Bizee figure | Period |
|---|---|---|
Companies formed as LLCs | About 9 in 10 (89.5%); 89.2% → 90.0% year over year | October 2024 – September 2026 |
Listed as S corporation · C corporation · nonprofit | 5.0% · 3.3% · 2.2% | October 2024 – September 2026 |
Most common industries (of those naming one) | Consulting 11.4% · real estate 10.3% · online retail 7.0% · construction 6.7% · administrative and support services 5.9%, the same top five both years | October 2024 – September 2026 |
LLC orders listing a single member | About 4 in 5 (80.8%); three or more 3.4% | July 2 – October 14, 2026 |
When orders are placed | About 4 in 5 (81%) on a weekday, Tuesday busiest; March (9.9%) and January (9.7%) the busiest months, December (7.2%) the quietest | October 2024 – September 2026 |
Orders completed on a phone | About 1 in 4 (26.5%) | July – September 2026 |
What the data show
Source: Bizee internal data, October 2024 – October 2026, each row's period as shown; formation orders as recorded on the order form; months differ in length; members as entered at formation; device at the moment the order was completed. Bizee customers are not all U.S. businesses.
What new business owners ask our support team most. One conversation can cover several topics:
Topic | Share of founder conversations |
|---|---|
Forming the company and the filing | 33.9% |
EIN | 22.3% |
Business address | 21.2% |
Annual reports | 19.4% |
Registered agent | 19.2% |
Changes to company details (amendments) | 17.5% |
Source: Bizee internal data, customer-support conversations from September 22 – October 15, 2026, classified by AI from the transcripts. Support contacts are not all Bizee customers, and Bizee customers are not all U.S. founders.
Bizee is NOT a law firm and does NOT provide legal advice. Use of our products and services is governed by our Terms of Service and Privacy Policy. The information you provide to Bizee is NOT protected by attorney-client privilege.